Unequal Carbon Footprints
compare your own carbon emissions with some of the largest emitters in the US
The Cement Industry and Greenhouse Gas Emissions
All Text from: Environmental Protection Agency (2016). Inventory of U.S. Greenhouse Gas Emissions and Sinks: 1990-2014.
Cement production is an energy- and raw material-intensive process that results in the generation of carbon dioxide (CO2) from both the energy consumed in making the cement and the chemical process itself. Emissions from fuels consumed for energy purposes during the production of cement are accounted for in the Energy chapter. During the cement production process, calcium carbonate (CaCO3) is heated in a cement kiln at a temperature of about 1,450 degrees Celsius (2,700 degrees Fahrenheit) to form lime (i.e., calcium oxide or CaO) and CO2 in a process known as calcination or calcining. The quantity of CO2 emitted during cement production is directly proportional to the lime content of the clinker. During calcination, each mole of limestone (CaCO3) heated in the clinker kiln forms one mole of lime (CaO) and one mole of CO2:
CaCO3 + heat -> CaO + CO2
Next, the lime is combined with silica-containing materials to produce clinker (an intermediate product), with the earlier byproduct CO2 being released to the atmosphere. The clinker is then allowed to cool, mixed with a small amount of gypsum and potentially other materials (e.g., slag, etc.), and used to make Portland cement. Carbon dioxide emitted from the chemical process of cement production is the second largest source of industrial CO2 emissions in the United States. Cement is produced in 34 states and Puerto Rico. Texas, California, Missouri, Florida, and Michigan were the five leading cement-producing states in 2014 and accounted for approximately 53 percent of total U.S. production (USGS 2015b). Clinker production in 2014 increased approximately 7 percent from 2013 levels. This increase can be attributed to an increase in spending in new residential construction and nonresidential buildings. In 2014, U.S. clinker production totaled 74,946 kilotons (USGS 2015a). The resulting CO2 emissions were estimated to be 38.8 MMT CO2 Eq. (38,755 kt) (see Table 4-3).
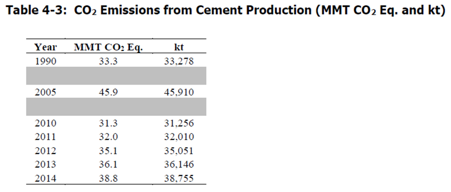
Greenhouse gas emissions from cement production increased every year from 1991 through 2006 (with the exception of a slight decrease in 1997), but decreased in the following years until 2009. Emissions from cement production were at their lowest levels in 2009 (2009 emissions are approximately 28 percent lower than 2008 emissions and 12 percent lower than 1990). Since 2010, emissions have increased slightly. In 2014, emissions from cement production increased by 7 percent from 2013 levels. Emissions since 1990 have increased by 16 percent. Emissions decreased significantly between 2008 and 2009, due to the economic recession and associated decrease in demand for construction materials. Emissions increased slightly from 2009 levels in 2010, and continued to gradually increase during the 2011 through 2014 time-period due to increasing consumption. Cement continues to be a critical component of the construction industry; therefore, the availability of public and private construction funding, as well as overall economic conditions, have considerable impact on the level of cement production (pp. 4-7, 4-8).
Profile of the largest emitter in the industry: the River Cement Plant in Festus, Missouri.